
2017 Piercing Statistics
In the spirit of openness and transparency—and in solidarity with this year’s Pornhub’s 2017 Year in Review—here are Infinite Body Piercing’s 2017 piercing statistics.
Last year we published our 2016 Piercing Statistics, which was the first time we’ve publicly published our yearly numbers. The response was encouraging: many readers commented on how fascinating they found the figures—not just the volume, but the breakdown of the services we offered. I also received feedback from other piercing studio owners, several of whom commended me on my confidence in divulging what they always considered personal data, information they all had, but most kept closer to their chest. This was a surprise for me, as I have been a big advocate of transparency and education. The more information we can share, the more informed we all become, and the better choices we can all make with our clients.
Total Piercings and Jewelry Insertions
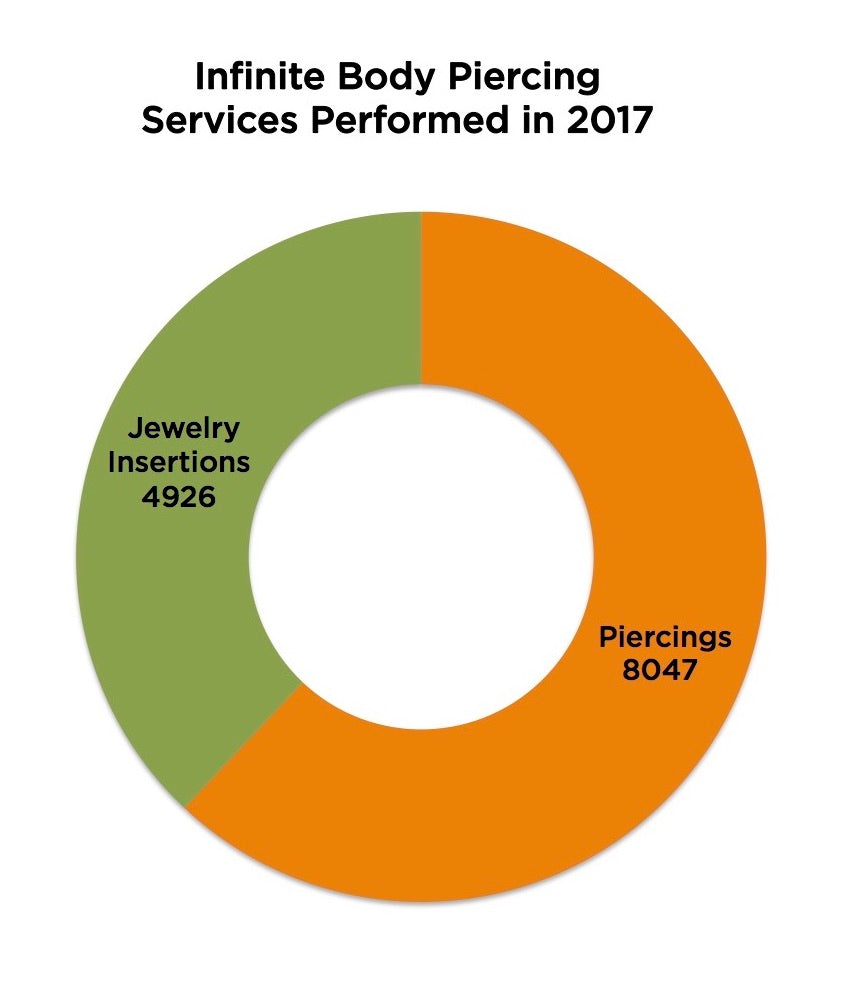
In 2017 we performed 12,973 services. (Note: this is not the number of clients, but the number of procedures performed, e.g., a set of pierced nipples would count as two items.) As we mentioned in last year’s article, piercing procedures are not the only service we offer, and this number includes not only piercings, but also instances where we are just inserting jewelry in an already-healed piercing. (We change jewelry and stretch piercings for clients, free of charge, regardless of whether the original piercing was done at our studio. Just tip your piercer!) In 2017, almost 40% of the services we performed were jewelry inserts: we did 4926 jewelry insertions, and 8047 piercings!
An average of 95 times per week we change jewelry in an existing piercing, with an average of 13.5 jewelry changes per day. In addition to that, we are doing just under 155 piercings a week, with an average of over twenty two per day—so between piercings and jewelry insertions, we’re offering an average of 35.6 services per day!
As a bit of a disclaimer: we are a very busy studio—a very busy studio—so these numbers shouldn’t be seen as representative of the numbers of clients seen at other studios. Several things make this possible: we’ve been in business for over twenty-two years; we’re a unique piercing-only studio in the sixth-largest city in the U.S., in terms of population; and restrictive zoning limits the number of tattoo and piercing studios in most parts of Central Philadelphia, grandfathering in studios who are already established but limiting newer studios’ opening. With all this, we’re in a unique position to see a whole lot of clients during the year.
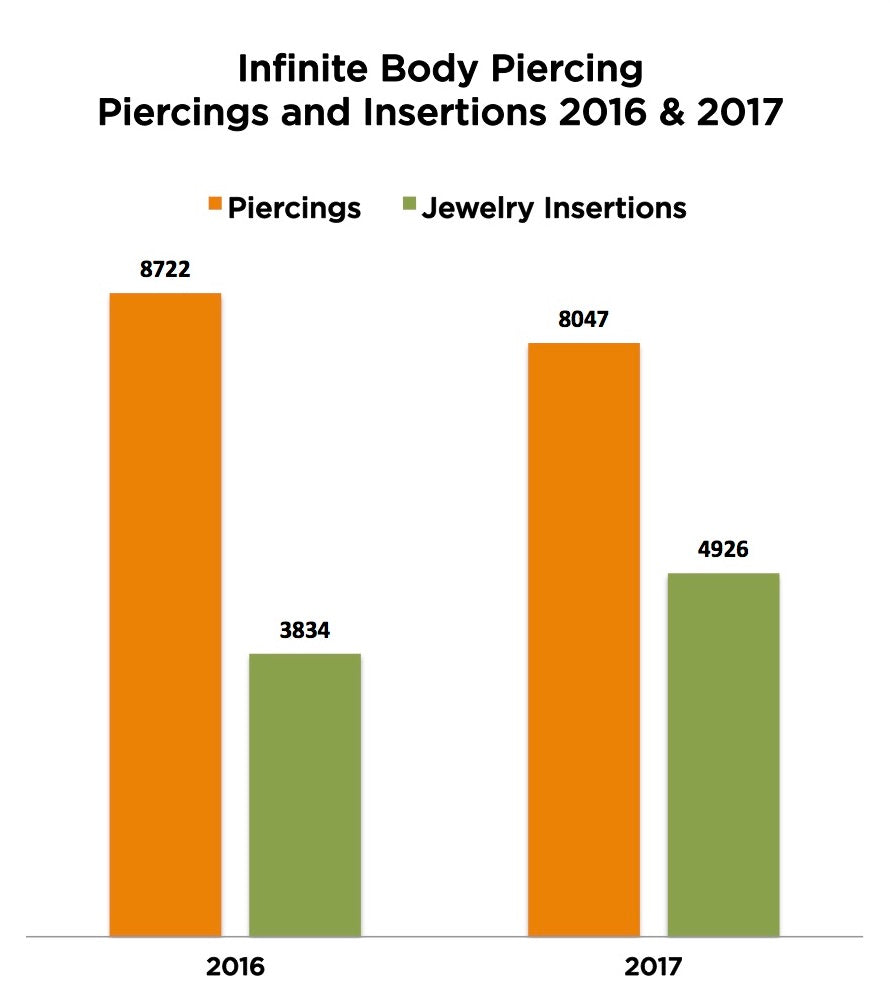
That all being said, we actually saw a decrease in the number of piercings done the year before: we performed 8722 piercings in 2016, while last year we had a total of 8047 piercings—almost 700 fewer piercings. But while we saw a decrease in the number of piercings, we saw a tremendous increase in the amount of jewelry insertions: 3834 insertions in 2016 up to 4926 insertions in 2017—an increase of 1092 jewelry insertions!
Total Piercings, by Type
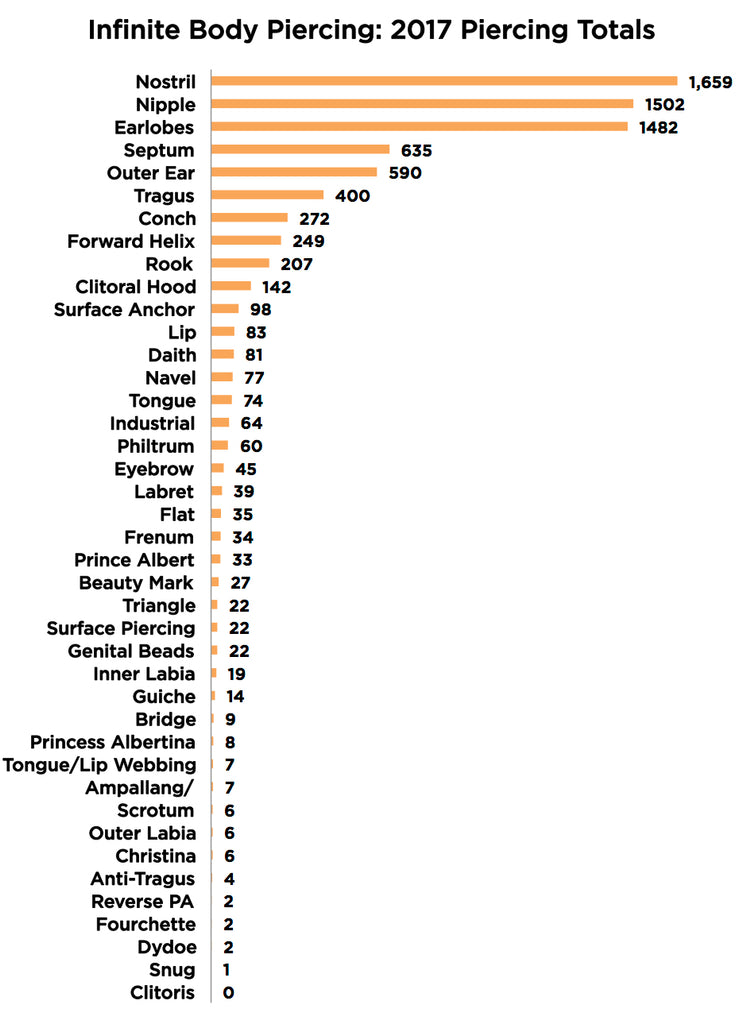
For the third year in a row (or at least since we started keeping track), the nostril piercing was the most-performed piercing at the studio. In 2015 we pierced 1697 nostril piercings; in 2016 it was 1690; in 2017 it was 1659. Last year we pierced an average of almost 32 nostril piercings per week, or more than four and a half per day, every day.
Our second most popular piercing is the nipple. In all we did 298 single nipple piercings and 604 double nipple piercings, making for 1502 nipples pierced in 2017. (That’s almost 29 nipples a week; over two pair each day.) Earlobe piercings were at number three this year with 1482 performed (that’s a little over four a day), with septum piercings at number four with 635. Outer helix piercings rounded out the top five with 590 done in 2017. The next four most popular piercings are all different ear piercings: 400 tragus piercings, 272 conch piercings, 249 forward helix piercings, and 207 rook piercings. The last piercing in the top ten is a genital piercing: we did 142 clitoral hood piercings last year.
Below is a breakdown of all our piercing numbers from 2017.
When you compare our 2017 piercing totals against 2016, most of our numbers are pretty consistent, with a few noticeable differences: We did significantly more earlobe piercings this year (1482 in 2017 vs. 1070 in 2016) in addition to fewer outer helix piercings (590 last year vs. 1092 the year before). We also did far fewer daith piercings this year: 81 piercings in 2017, where in 2016 we did a whopping 249 of them. The higher numbers in 2016 can undoubtedly be attributed to the trend of clients requesting daith piercing in an attempt to cure migraines. Do the lower numbers this year indicate the trend is slowing down?
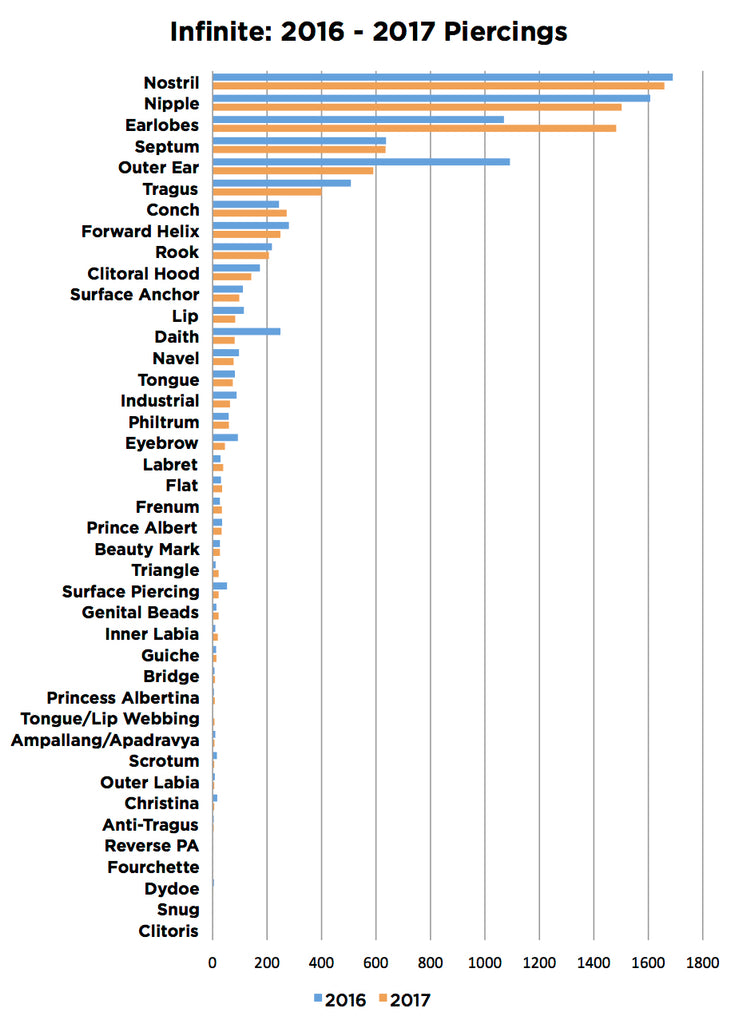
One interesting fact not shown in this chart that may indicate a larger trend is: in 2017, we removed (113) more surface anchors than we inserted (98).
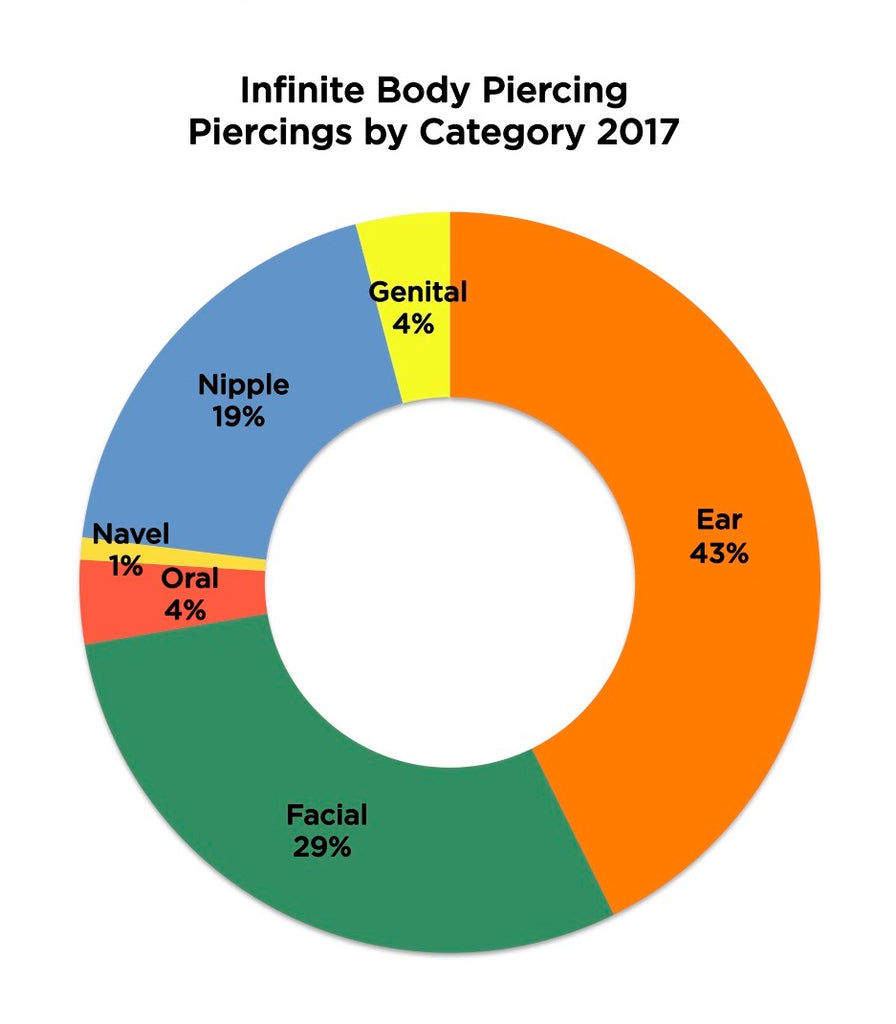
Piercings by Category
When we break down numbers by category, you can see that our most popular piercings are ear piercings. In 2017 we performed 3385 ear piercings, which accounted for over 40% of our piercings. Facial piercings numbered 2348, which made up a little under 30% of our total piercings. We performed 290 oral piercings piercings last year, making up 4% of our total. While navel piercings numbered 77 and only made up barely 1%, nipples made up almost 20% of our total piercings performed last year, with 1502 nipples pierced. Genital piercings numbered 325 and made up 4% of our totals from last year.
Client Demographics
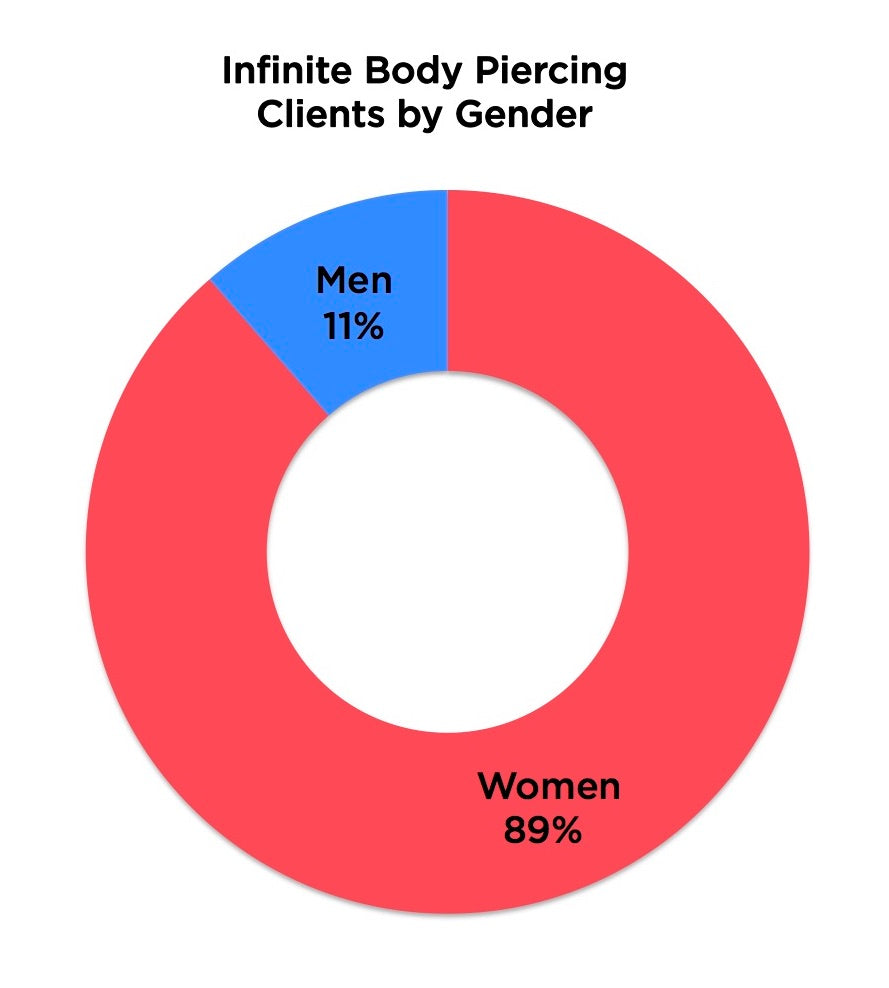
While our POS system does give us a lot of information about what clients are buying, it doesn’t give us much information about the clients themselves. So this year, we once again manually went through release forms to see what additional data we could gather to give us more of a sense of exactly who our clients are. We sorted through two weeks of release forms from earlier this year, dated January 21 to February 3rd, and made note of both gender and date of birth. While this is a rather small sample size (595 people), it does give some insight into who our clients are.
During these time, we had 527 women in for piercings and 68 men. Consistent with last year’s findings, our sample showed just under 90% of our clients are women, while a little over 10% are men. We do regularly pierce trans clients and/or clients who identify outside of the gender binary, but at this time their numbers are statistically few when compared to the total client numbers.
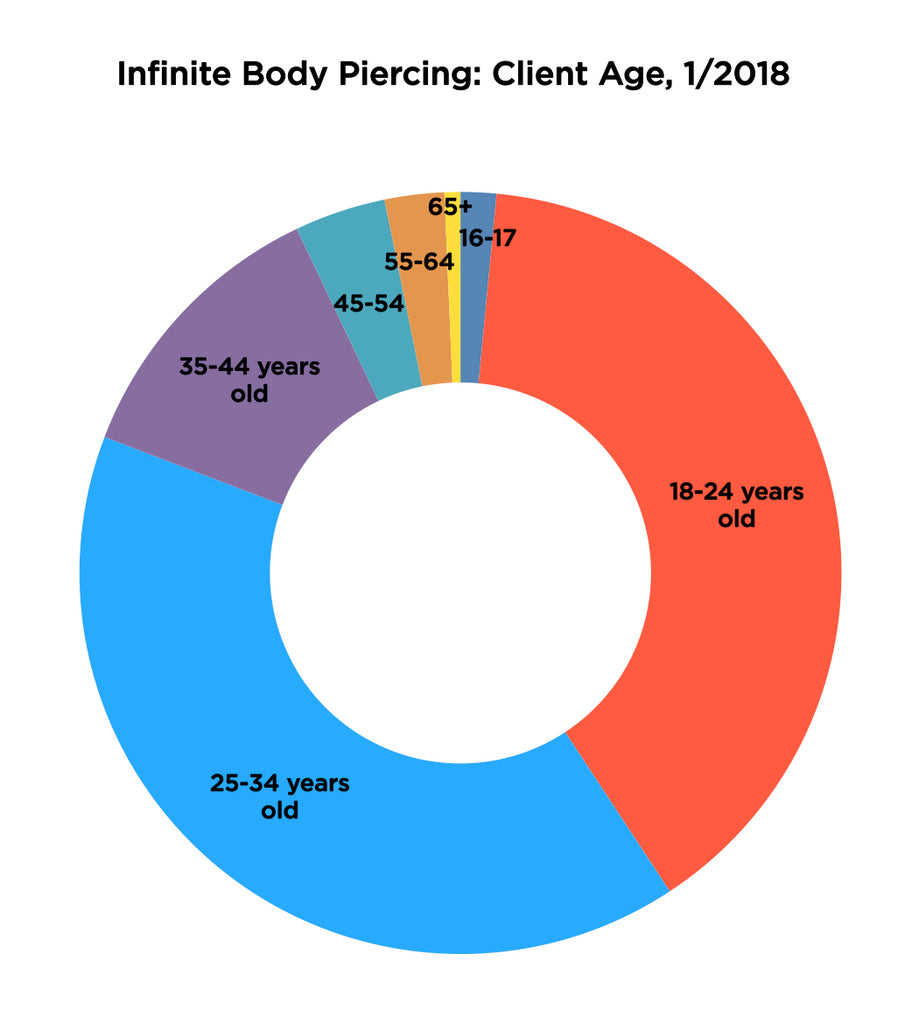
We also tracked birth dates for our two-week sample. Again, while this is not a huge sample size, it does offer some solid insight into at what age most of our clients are visiting us. Predictably, the demographics of our clients tend to skew a bit younger—but definitely not as young as we would have guessed. Minors make up a small selection (1.5%) of our clients. (Philadelphia regulations prohibit us from piercing anyone under sixteen years of age, so this includes clients 16 and 17 years old.) Not surprisingly, 18 to 24 year olds make up a large percentage of our clients, about 40%, while 25 to 34 year olds make up the same percentage of clients. This places a full 80% of our clients between the ages of eighteen and thirty-five years old.
Clients ages 35 to 44 years number at around 12% of our clients, 45 to 54 year olds make up about 4%, 55 to 64 year olds made up 2.5% of our clients, and clients over 64 made up a small (0.7%) percentage of our clients from our two-week sample.
What is also interesting is that the breakdown of clients by age is proportionate with any gender, i.e. the 90/10% breakdown of women to men is consistent across every age group.
Congratulations! You’ve made it to the end of an article on statistics. This topic can be either fascinating or tedious—and there is usually little middle ground. I hope we’ve presented these in enough of an engaging way that everyone can geek out on these numbers almost as much as we did.
Comments
Leave a comment